Observability for Vision Services Running 24/7
Latency percentiles, confidence drift, GPU thermals, and downstream error rates. The dashboard that tells you a camera is failing a week before the plant manager does.
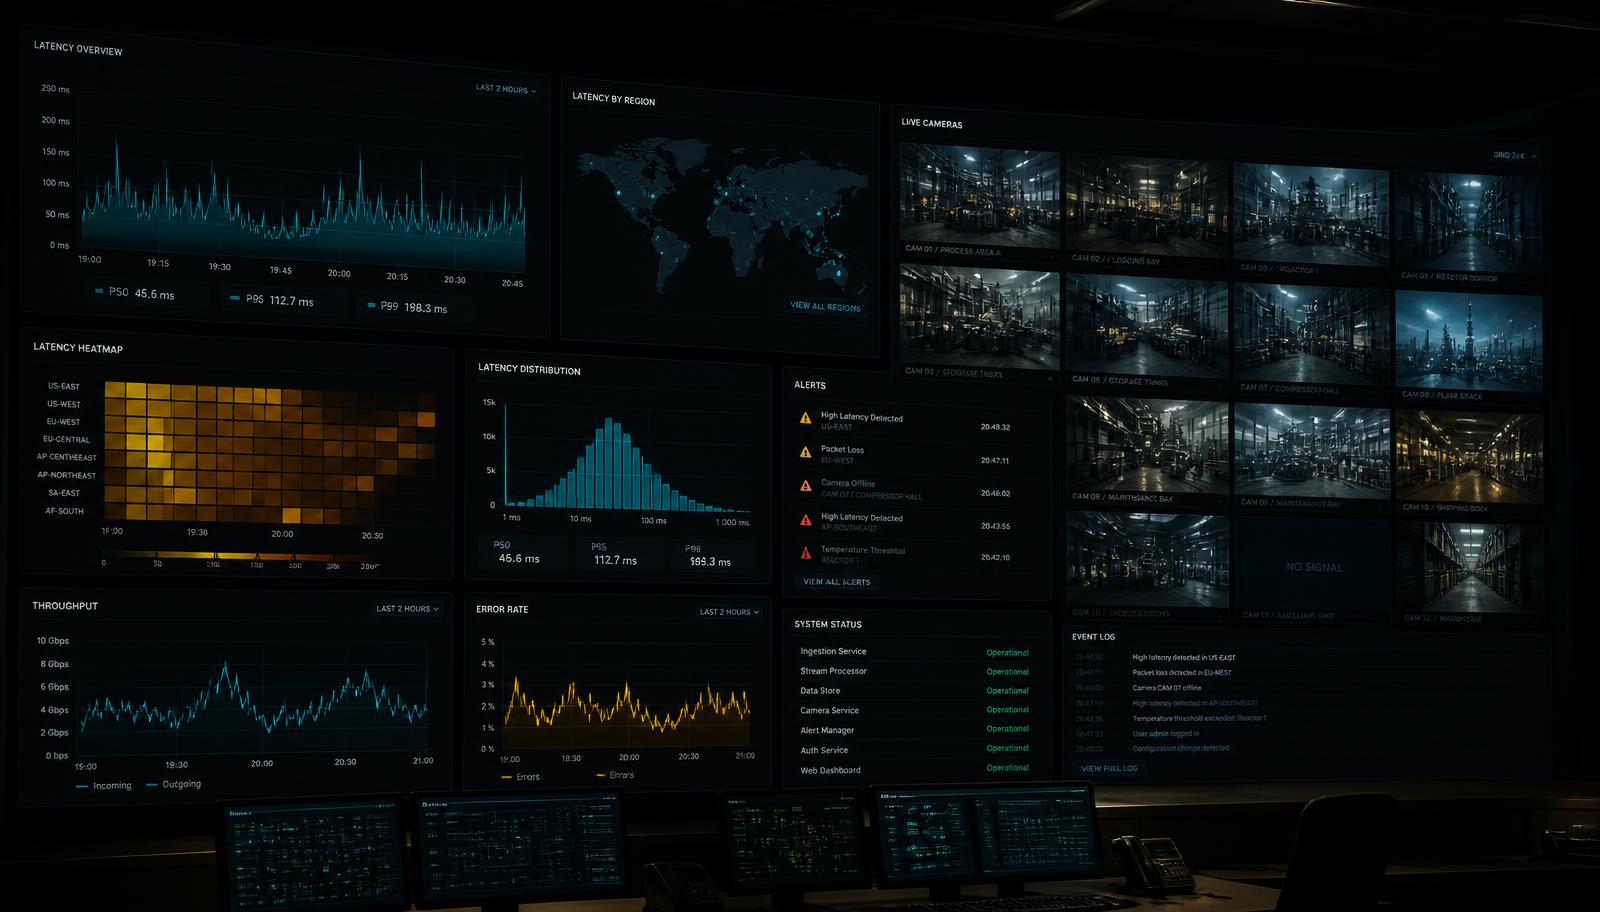
A vision service that runs continuously does not fail the way software usually fails. It rarely throws. Lenses fog, a mount vibrates two degrees out of alignment over six months, seasonal light through a roof window shifts the input distribution, and a GPU quietly throttles at 84 degrees every afternoon in July.
None of that produces a stack trace. All of it produces worse decisions. Observability for industrial vision is therefore mostly about watching distributions, not exceptions.
Four families of signal
- Throughput and latency percentiles per camera, measured sensor-to-event
- Prediction confidence distributions over rolling windows, per class and per camera
- Hardware: GPU and SoC temperature, clock throttling, memory pressure, disk for buffered clips
- Downstream: PLC handshake failures, API error rates, message queue depth, retry counts
Per-camera granularity is non-negotiable. Aggregated across sixteen cameras, a single failing unit disappears into the average. Per camera, it is obvious within a day.
Alert on drift, not just on errors
A camera whose mean confidence dropped fifteen percent over a week is broken, even though nothing threw an exception.
Compare the last 24 hours against a trailing 14-day baseline for each camera: mean confidence, detection rate per thousand parts, and the share of decisions landing in the escalation band. Any of the three moving beyond a set tolerance raises a maintenance ticket, not a pager alert. Most of these turn out to be a dirty lens or a loosened mount, and both are cheap to fix while the line still runs.
Keep the pixels that caused the alert
For every alert, store a sampled set of frames with their model outputs, retained for a defined window. Debugging a drift incident without the pixels that caused it is archaeology with no dig site. A rolling 30-day store of sampled frames costs almost nothing and pays for itself the first time a customer disputes a rejected batch.
Build the dashboard the plant actually reads
Engineers want percentiles. Plant managers want three numbers: is the line running, how many parts were inspected this shift, and how many needed a human. Publish both views from the same data, and put the vision metrics on the same screen as line throughput so the system is judged inside the production context rather than as a separate IT concern.
- Shift-level summary, emailed automatically, in the plant's own vocabulary
- Per-camera health tile with a single status colour and a last-seen timestamp
- A documented failover path: what the line does when the vision service is down
The goal is unglamorous. Nobody should be surprised by the vision system, in either direction. When it degrades, it should say so first.
Facing this in your own pipeline? Bring the stream specs and we will scope the audit.
Discuss a WorkflowRTSP Streams That Don't Drop Frames
Most industrial vision projects fail at ingestion, not inference. A field guide to stable multi-camera decoding, bounded queues, and the reconnect logic nobody writes until a night shift burns them.
11 JUL 2026INT8 Quantization Without Losing the Accuracy You Paid For
TensorRT calibration is not a checkbox. How to choose calibration data from the factory floor, which layers to keep in FP16, and how to prove the quantized model still catches the defect that matters.